
What is Splunk?
The platform of Splunk allows us to get visibility into machine
data generated from
different networks, servers, devices, and hardware.
It can give us insights into the application management, threat
visibility, compliance, security, etc. so it is used to analyze machine data.
The data is collected from the forwarder from the source and forwarded to the
indexer. The data is stored locally on a host machine or cloud. Then on the
data stored in the indexer the search head searches, visualizes, analyzes and performs
various other functions.
Why use Splunk
- It
reduces troubleshooting and resolving time by offering instant results.
- With
the help of Splunk UI we can able to generate graphs, alerts, and
dashboards on real-time data.
- Summarizing
and collecting valuable information from different logs and other important
sources.
- Offers
most powerful search analysis, and visualization capabilities to empower
users of all types.
- It
can easily search and investigate specific results using Splunk.
- It
allows you to troubleshoot any condition of failure for improved
performance.
- Helps
us to monitor any business metrics and make an informed decision.
- Splunk
allows you to incorporate Artificial Intelligence into your data strategy.
- Allows
us to gather useful Operational Intelligence from your machine data
- Allows
us to create a central repository for searching Splunk data from various
sources.
Splunk Features
Data Ingestion
Splunk can ingest a
variety of data formats like JSON, XML and unstructured machine data like web
and application logs. The unstructured data can be modeled into data the structure as needed by the user.
Data Indexing
The ingested data
is indexed by Splunk for faster searching and querying on different conditions.
Data Searching
Searching in Splunk
involves using the indexed data for the purpose of creating metrics, predicting
future trends and identifying patterns in the data.
Splunk Alerts
Splunk alerts can
be used to trigger emails or RSS feeds when some specific criteria are found in
the data being analyzed.
Dashboards
Splunk Dashboards
can show the search results in the form of charts, reports, and pivots, etc.
Data Model
The indexed data can
be modeled into one or more data sets that are based on specialized domain
knowledge. This leads to easier navigation by the end-users who analyze the
business cases without learning the technicalities of the search processing the language used by Splunk.
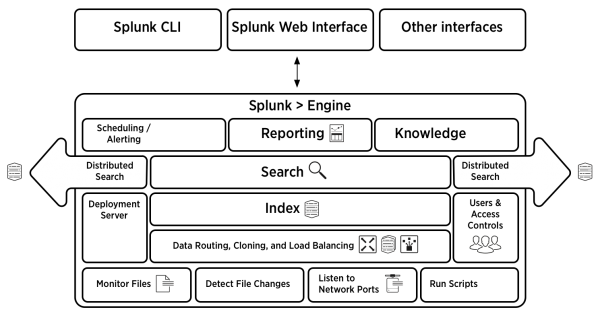
Splunk Architecture and Different Components
The main components of Splunk are Forwarders, Indexers and Search
Heads.
Deployment Server (or Management Console Host) will come into
the picture in case of a larger environment.
Deployment servers act as an antivirus policy server for
setting up Exceptions and Groups so that you can map and create a different set
of data collection policies each for either window-based server or a Linux
based server or a Solaris based server.
 |
| Splunk Architecture |
Splunk
has four important components:
Indexer – It indexes the machine data
Forwarder – It collects data from a remote machine and then forward that data
to index on a real-time basis.
Search Head – It Provides GUI for searching, analysis
and visualization.
Deployment Server –Manages the Splunk components like indexer, forwarder,
and search head in a computing environment.
SPL Commands in Splunk
Search Processing Language (SPL) is a language
containing different commands, functions, arguments, etc, which we write to get
the desired results from the data sets.
For example, when we obtain a result set for a
search term, we may need to further filter that with more specific terms from
the result set. For this, we may need some additional commands to be added to
the existing command. This can be done by using SPL.
Categories Of SPL Commands
SPL commands are divided into five categories:
1.
Sorting
Results – Ordering results and (optionally)
limiting the number of results.
2.
Filtering
Results – It takes a set of events or results
and filters them into a smaller set of results.
3.
Grouping
Results – Grouping events so you can see
patterns.
4.
Filtering,
Modifying and Adding Fields – Taking search results and generating a summary for reporting.
5.
Reporting
Results – Filtering out some fields to focus
on the ones.
Splunk Buckets and its Life-Cycle
A directory that contains indexed data is known as a Splunk
bucket. It also contains events of a certain period. Bucket life-cycle includes the following stages:
Hot – It contains newly indexed data and is open for writing. For each
index, there
are one or more hot buckets available.
Warm – Data rolled from hot.
Cold – Data rolled from warm.
Frozen – Data rolled from cold. The indexer deletes frozen data by default,
but users can also archive it.
Thawed – Data restored from an archive. If you archive frozen data, we
can later
return
it to the index by thawing (defrosting) it.
Alerts in Splunk
An alert is an action that a saved search triggers on regular
intervals set over a time range, based on the results of the search.
When the alerts are triggered, various actions occur consequently.
For instance, sending an email when a search to the predefined list of people
is triggered.
Three types of alerts:
1. Pre-result alerts: Most commonly used alert type and runs in real-time for
an alt time span. These alerts are designed such that whenever a search returns
a result, they are triggered.
2. Scheduled alerts: The second most common- scheduled results are set up to
evaluate the results of a historical search result running over
a set time range on a regular schedule. You can define a time range, schedule and the
trigger condition to an alert.
3. Rolling-window alerts: These are the hybrid of pre-result and scheduled alerts.
Like the former, these are based on real-time search but do not
trigger each
time the search returns a matching result. It examines all
events in real-time mapping within the rolling window and triggers the time
that specific condition by that event in the window is met, like the scheduled the alert is triggered on a scheduled search.
